The online ad spent may be local or global, rising daily in the market. Creating ads in minutes and better engaging the social media audience is the only task for the present marketers or influencers, whoever they may be. Why does this happen?
The only player in digital marketing that millions of businesses rely on. We can say that digital marketing is the future of business brands from small scale to large scale. The statistics about the performance of digital marketing can define its victory.
Digital Marketing and Advertising Statistics
SEO is the highly preferred inbound marketing strategy stated by 61 marketers.
Google is responsible for driving 94% of SEO traffic to business websites.
52.2% of all online traffic in 2018 was generated only through mobile, up from 2017, which is 50.3%.
In 2017 the mobile ad spent was $22.18 Billion, and 3.8% is the average mobile conversion search rate on Google.
74% reported using Facebook for professional purposes, and 75% to 90% of Facebook advertising comes from images.
Twitter is the marketing tool for 88% of business brands having above 100 employees, and tweets with video find retweets six times more than tweets with text or images.
60% of consumers find products or services on Instagram, and 2 am or 5 pm or the best time to upload an Instagram post.

Year over year, the ad spending on Instagram stories found a 220% increase, and 75% of Instagram users visit the business website after watching the ad.
80% of Business to Business (B2B) leads come from LinkedIn, 7% from Facebook, and 13% from Twitter.
LinkedIn is the #1 social media channel for B2B marketers to widespread 94% of the content, and B2B marketers reduced 94% of the cost per lead using LinkedIn lead generation forms.
While comparing with other social media channels, Pinterest users spend 50% more on average, and 80% of millennial pinners stated that Pinterest helps them with what to buy.
144% of products or services buy by video, and 50% of internet users look for product videos before visiting the business store.
74% of conversion optimization strategies increased business sales, and A/B testing is the most effective conversion rate method.
50% of consumers stated that online live chat is the best way to reach business brands.
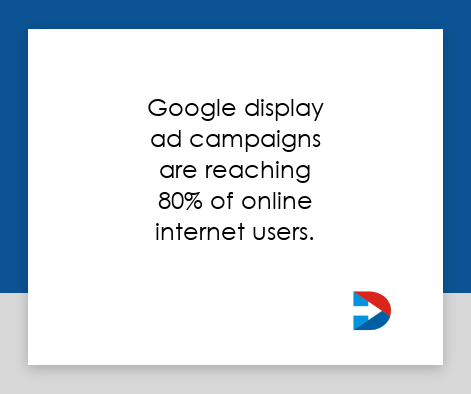
Google display ad campaigns are reaching 80% of online internet users.
Clicking products on ads is mainly liked by 70% of millennials.
In 2018 Goo,gle took out 2.3 billion ad campaigns.
82% of B2B marketers bring the brand reputation through content marketing.
2/3rd of people watch YouTube while watching Television at home.
A branded video on YouTube engages 32% of the audience.
43% of the audience is expecting more video content from marketers.
Video is going to hit 82% of all internet traffic in 2020.
Because of pop-up ads, 81% of visitors exit a website.
72% of consumers have a lower opinion of business brands that use pop-up ads.
97% more links received to the website for the companies that blog.
Over $365,544 million of revenue will be spent on digital advertising by 2020.
Search adverting is discovered as the largest segment in the U.S. advertising market, with $139,853 million by 2020.
According to the Global Survey, Over 900 advertising leaders fund worldwide.
At least half of the companies rely on the Digital advertising staff to optimize their ad spend on digital channels for brands.
59% of the brands rely on digital marketing staff who optimize their ad spend on Facebook and Instagram ads.
53.6% of digital ads are displayable and viewed on desktop devices. That means more than half of the advertisements are not displayable.
35% of ad spending in Indonesia is expected to grow by 2020.
The last two years have seen drastic digital ad spending growth, and they expect to continue its growth steadily.
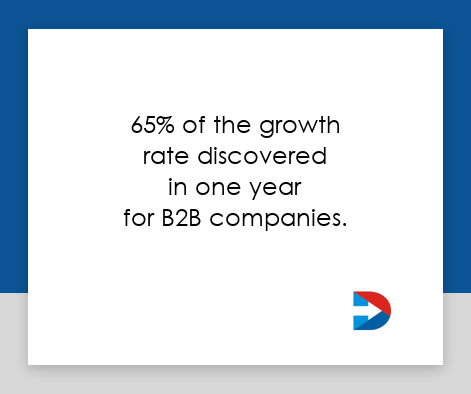
65% of the growth rate discovered in one year for B2B companies.

According to the Survey, over 60% of the ads are viewed on mobile devices. Video viewing on mobile devices is increasing year by year.
57% of the digital ads are optimized for the Google search engine.
94% of advertisers use CRM data for brands’ target advertising. CRM data consists of emails, phone numbers, and other contact data.
70.76% of views were recorded as complete ad viewers worldwide.
Video marketers described 60.67% as the overall viewable rate for digital ads.
Pets, food, drinks, family & parenting brand categories have performed well under native video advertising.
In a survey from Life Marketing, 64% of consumers click on Google ads for product buying.
eMarketer’s analyzed that Native video advertising is the most popular and fastest-growing segment, with a 35% growth rate recorded by 2019.
By 2019, $41.1 billion in ad revenue increased in Native video advertising and 61% of the growth rate projected in total digital ad spending in the U.S.
Among all digital ads, 73% of consumers are unwilling to view pop-up ads.
Digital Marketers estimated that over $375 billion in Global digital ad spend revenue will increase by 2020.
Over 18% of the purchase intent increased on native video advertising.
91% of advertisers are willing to buy Data management platforms for digital advertising.
Over 66% of the digital ad revenue goes to Google search engines, Facebook, Instagram, and YouTube.
A 65% growth rate was noticed in digital advertising compared to last year. Companies are adopting digital video ads for brand promotions.
52% of the video advertising spending growth rate noticed in B2C companies for over one year.
Conclusion
Marketers were required to make decisions about media buying at their companies. Digital Marketing and advertising are leading this digital world. Companies should take the burden of decision-making authority and advertise their brands through digital marketing. Here are the 50 impressive digital marketing and advertising Statistics for your business.
